Math and gerrymandering
about my side gig that's probably on the way out

When I stopped being a professional physicist and was looking for a data science job, one thing I did on the side was doing technical translation between English and Japanese, as a freelancer. It wasn’t exactly lucrative, but it did give me some income during the months when I didn’t have a full-time job.
Separately, and well before this happened, I had connected with one of the editors at Nikkei Science on the social media network formerly known as Twitter (Nikkei Science is the Japanese version of Scientific American). She discovered at some point that I was doing technical translations, and asked if I wanted to translate an article.
It was called “Geometry versus Gerrymandering.” Later, I translated another article: “Citizens’ Assemblies Are Upgrading Democracy: Fair Algorithms Are Part of the Program”. I guess I’m the math-in-politics person until machine translation takes over. I’ll talk about some of the content of the first article and my take on it.
Gaming the electoral system
For the amount of time and effort people spend arguing about politics, we really pay negligible amounts of attention to the rules that are behind that politics. This is perhaps understandable. Most people (especially Americans) don’t move to a different country and vote in a different kind of election. For that matter, a lot of people even don’t know how exactly their own system works.
But if you learn a bit of political science, you realize that the rules make a big difference in the political outcomes. As an example, Duverger’s law states that when most elections use simple plurality voting (whichever individual gets the most votes wins), you tend to have 2 major parties emerge.
Gerrymandering is one of the ways that politicians can take advantage of the rules, or really, bend the rules to their advantage. The term comes from the early 19th century Massachusetts Governor Elbridge Gerry1, who redrew one of the state senate district to look like the “salamander” in the cartoon below.

This was done to help his Democratic-Republican Party, and it worked. Even though Gerry lost his next re-election campaign, i.e. in a statewide election, his party retained control of the state senate.
The way gerrymandering works is through 2 methods:
Packing, where you put a large number of voters who are against you. This gives up a district, but it will be an extremely easy win where your opponents waste a bunch of votes.
Cracking. In the districts where you didn’t pack opposing voters, you want to distribute them so that there aren’t enough to win the election in any of them.
In the past, gerrymandering was usually obvious through visual inspection. If you saw a district that looked misshapen, that was often a sign of ill intent.
A side note on racial gerrymandering
Some districts have strange shapes, but for a different reason than partisan gerrymandering that benefits one party over another. One example is Illinois’s old 4th district, a.k.a. “earmuffs”. Before last year, the district looked like this.

You would suspect that there was something funny going on, and you’d be right. But this is basically gerrymandering for the purpose of giving Hispanics a seat. This district contained the Hispanic-heavy neighborhoods of Logan Square and Humboldt Park to the north and Pilsen and Little Village to the south. See this Sun-Times article for more on this particular district.
There are many districts in the country where the majority of the population is non-white. This is a direct result of the Voting Rights Act of 1965 and court cases following it, which discouraged states from “cracking” minority votes. Whether or not you agree that there should be majority-minority districts like this, this is a slightly different issue from a political party trying to gain seats through gerrymandering2.
Fancy gerrymandering
You might think you can spot gerrymandering by looking at the map, but it doesn’t work reliably. These days, gerrymanderers are getting better at doing it with “compact” districts that don’t look weird at all. This is North Carolina’s gerrymandered districts from 2021, which was later struck down by the courts.
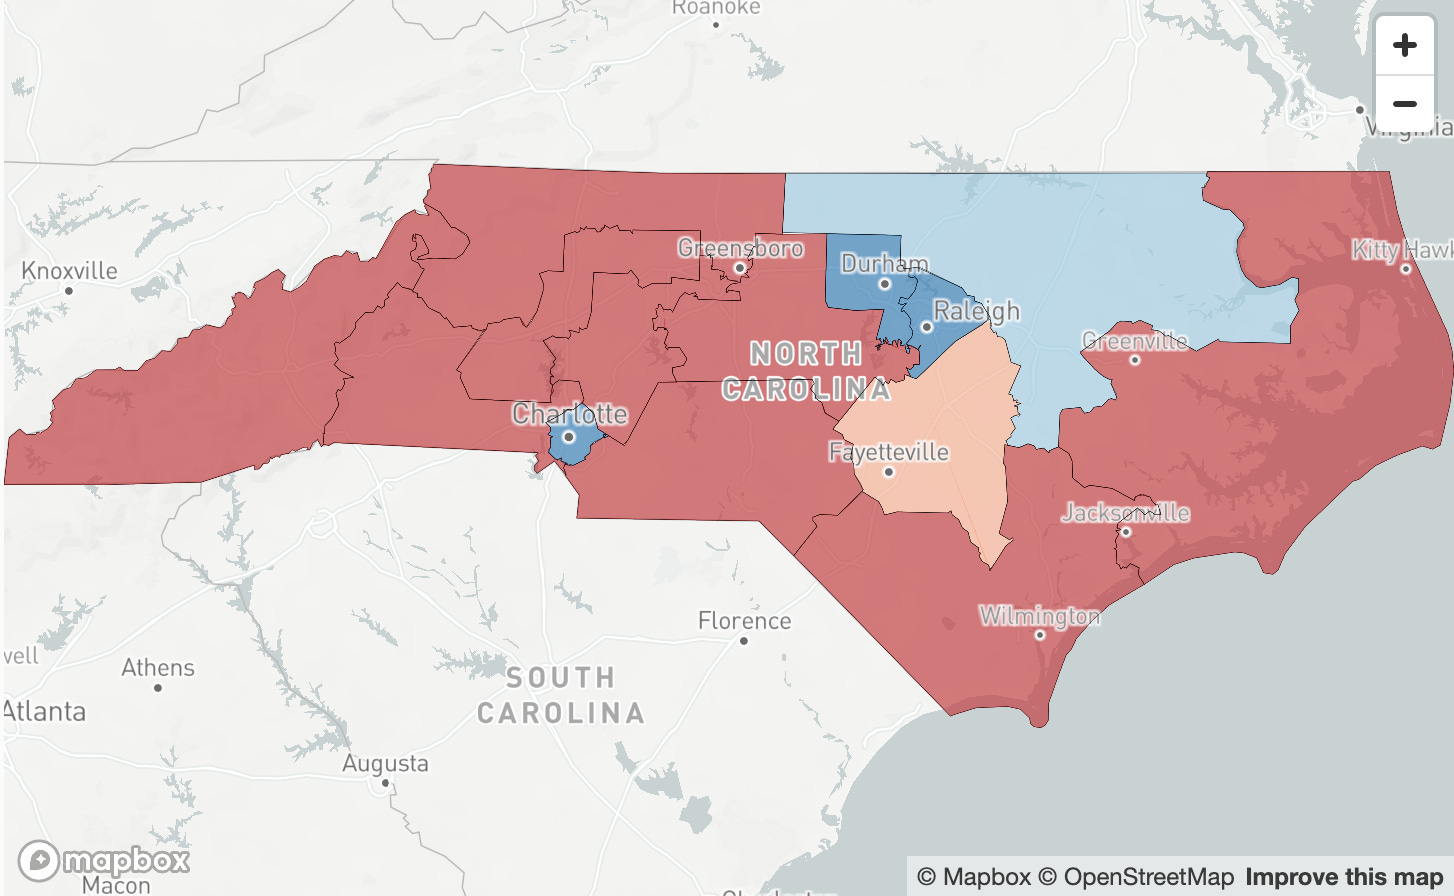
Other than maybe 2 districts near Greensboro and Charlotte, these districts don’t look fishy at all. But this map has 2 competitive districts, 3 districts that are very solidly Democratic, and 9 districts that favor Republicans.

If you can’t just look at the map, how do you detect gerrymandering? It turns out that you need to know a bit more than just the proportions of votes that go to the 2 major parties. That’s because Democrats tend to live in urban areas, which are more likely to get “packed” even if no one is trying to disadvantage them.
So a bunch of mathematicians started researching what the typical result of a redistricting should be, so that you can tell when a state did something very atypical in choosing the boundaries. That’s what the article is about.
Start of somewhat technical content
The main issue here is that the number of possible ways to choose districts for a state is beyond astronomical. Let’s say you had to split a 9-by-9 grid of precincts into 9 equal-sized, connected districts. The number of ways to do that is about 700 trillion (7 with 14 trailing zeros)3. In the real world with a real state, there’s a lot more than 81 precincts to split, and your precincts all have different populations. Basically, you’re not going to be able to list out all the possible ways to create districts.
So instead of listing out all the cases, what they do is to simulate many, many ways that you can choose the districts, using what’s called Markov chain Monte Carlo (MCMC)4. They start from a random (plausible) district map, and choose a “neighboring” map, i.e. the map where a pair of precincts are swapped between districts, and that’s your 2nd map. The 3rd map is a neighboring map of the 2nd map, and so on, until you have collected millions of possible maps.
The math of MCMC is that if you do this for long enough, your collection of maps will be representative of the whole set of possible maps. This makes an intractable problem (listing all possible maps) into a tractable problem (generating a large but manageable number of maps).
Once you have this big sample of maps, you can see what kind of election results you can expect from typical maps. If a map in the real world (actual or proposed) is an outlier, where one party has a big advantage compared to the typical map, you’re almost certainly looking at gerrymandering.
End of somewhat technical content
My take
I decided to write about this here because of this article on Quanta Magazine. It’s about how mathematicians are improving their simulation methods, so that their results are more reliable.
This is cool research (see footnote for more details5), and it does seem to matter somewhat in some cases—the article gives the case of Virginia, which has a strict limit on the population difference between districts that complicates simulations. But it seems to me that we don’t actually need fancy math and computation to address this problem.
I mean, look at this again.
The 9 solid red districts are just below the “competitive zone”, and the 3 solid blue districts are way above that zone. Once you know more than to only focus on weird district shapes, what’s happening isn’t that subtle. We don’t need a slightly better estimate of how bad the gerrymandering is. What we need is political solutions that make it hard to do it to begin with.
One direct solution for partisan gerrymandering would be mandating independent commissions for redistricting. But if you want a longer shot (what I’m here for), preventing gerrymandering doesn’t have to involve redistricting at all.
Late last year, Matthew Yglesias posted a (paid) podcast interview with Lee Drutman, who is working on bringing proportional representation to the US (see this report by Drutman and Scott Mainwaring for free content). Proportional representation is a voting system where you elect multiple candidates from a district (which could be a country, a state, etc.), so that the number of representatives from each party is proportional to their vote share.
So instead of having 17 congressional districts in Illinois, you could have a statewide election where you elect all 17 at the same time. Let’s say Democrats get 10/17 = 58.8% of the votes, and Republicans get 7/17 = 41.2%. Then there will be 10 Democrats and 7 Republicans going to the House from Illinois.
If there are no districts, there’s no gerrymandering. Simple.
Drutman’s argument partly relies on the fact that doing proportional representation actually doesn’t require a constitutional amendment. It still seems like a pretty long shot6, but I wholeheartedly agree with this part.
Lee: That's right, and it's very weird that these tiny differences in where you draw the lines can reverberate to who controls Congress. I don't know if you've been following all these gerrymandering court cases as closely as I have, but it's like every week, some state court says “This map is okay, or this map's not okay,” and then a bunch of forecasters say, “well, this increases Democrats’ chances of taking the House, or this makes it a lot harder for Democrats to take the House.” What a freaking weird system that is in which rather than voters deciding or parties getting a proportionate share of their seats, we have some small number of state court judges who are deciding whether some map is okay, or whether it needs to be redrawn, will determine which party gets the javelin.
What I’m listening to now
A couple of years back, Spotify sent me a bunch of songs from Montreal that I loved, and I saw that the artists had tens of thousands of monthly listeners, which would make them somewhat obscure even for indie music. These are people like Bon Enfant and LUMIÉRE (actually Bon Enfant’s drummer), who play great retro rock, Choses Sauvages and Barry Paquin Roberge, who have very different takes on disco, TEKE::TEKE, a Japanese psychedelic band…I really could keep going. MUNYA is another artist from Montreal.
Looking at the number of listeners on Spotify, MUNYA is a lot more well-known than the people above, maybe because she sings in English as well as French. Jardin is mostly dreamy synthpop. There’s a super-mellow cover of New Order’s “Bizarre Love Triangle”, as well as a sublime re-working of a Saint-Saëns aria that’s heavy on vocal harmony (“Caramel”).
If you like this, I also want to point you to Pearl & The Oysters (Paris/Florida/LA) and strongboi (South Africa/Berlin).
Gerry is pronounced with a hard g, so gerrymandering was originally pronounced with a hard g. Most people don’t do that now.
Illinois’s congressional map is a very gerrymandered one for Democrats, with 7 districts that are just safe for Democrats, and 3 solidly red districts. But the 4th district is a very easy win for Democrats (2nd easiest in the state), so Democrats are wasting votes by having this heavily Hispanic district. It’s also probably the case that since they gerrymandered so hard in the rest of the state, they can easily afford to do this for other political reasons.
It’s actually a lot of work to calculate this number because of the “connected” condition on districts.
“Markov chain” refers to the fact that your step (next map) only depends on your current state (current map).
“Monte Carlo” refers to how the choice of precincts to swap is random.
They want to make sure that they’re not getting stuck in a little corner of the graph of possible maps. What often happens in this kind of simulation is that if you do more work during each step (rather than just picking 2 precincts at random and swapping them), you can get your simulated distribution to converge faster to the true distribution.
Although, I’ve been talking up ranked-choice voting since back when it seemed farfetched in the US (we called it instant-runoff voting), and it’s gotten way more common.